

If you are new to Madhuri market charts, the different numbers, dates, and result columns can initially seem difficult to understand. A properly organized chart can make this information much easier to read because it brings historical records together in one place.
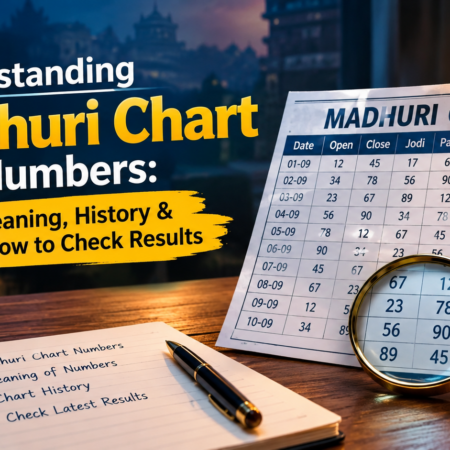
Madhuri chart numbers are generally presented as part of historical market records. Depending on the chart format, users may find information such as dates, open and close results, jodi numbers, and panel records. Understanding what each section represents is useful when you want to check an older record or learn how a particular chart is structured.
This guide explains the basic meaning of Madhuri chart numbers, how historical records are arranged, what jodi and panel numbers mean, and how to check chart information online in a simple way.
What Is a Madhuri Chart?
A Madhuri chart is a date-wise record used to organize historical information related to the Madhuri market. Instead of searching for individual results separately, users can refer to a chart where previous records are arranged chronologically.
The exact design can vary depending on the website providing the information. Some charts may display only basic result numbers, while others can include additional details.

Common sections may include:
- Date of the record
- Open result
- Close result
- Jodi number
- Panel or panna number
- Previous market records
- Historical chart information
For beginners, the easiest way to understand a chart is to start with its headings. The headings explain what each number represents and help prevent confusion between different result categories.
Understanding Madhuri Chart Numbers
The numbers shown in a Madhuri chart should always be read in relation to the date and column where they appear. A number by itself does not provide enough information to understand its purpose.
For example, a two-digit number displayed under a jodi column has a different role from a three-digit number displayed under a panel column. Similarly, an open or close result may be presented in a separate section.
When checking Madhuri chart numbers, first identify the date and then follow the row across the chart. This simple approach makes historical records easier to understand.
It is also important to remember that historical chart information describes previous records. It should not be considered a guaranteed method for determining future results.
What Does a Jodi Number Mean?
Jodi is a commonly used term in traditional number-chart terminology. It generally refers to a two-digit pair.
For example, numbers such as 24, 36, or 78 can illustrate the format of a two-digit jodi. These examples are provided only to explain how the terminology works and are not predictions.
When you look at a Madhuri chart, the jodi information is normally separated from other categories. Checking the column heading can help you identify whether the number represents a jodi or another type of record.
For someone learning how charts work, understanding this distinction is important because several numerical formats may appear together.
What Is a Panel Number?
A panel, also known as panna in some traditional terminology, generally refers to a three-digit combination.
A historical chart may display panel information alongside other result categories. Because panel records contain three digits while jodi records contain two digits, they can usually be distinguished by both their format and their column heading.
However, chart layouts are not always identical. Therefore, it is better to rely on the labels provided by the specific chart rather than making assumptions based only on the number of digits.
How to Read a Madhuri Chart
Reading a historical chart becomes much simpler when you follow a fixed process.
Step 1: Find the Date
Begin by locating the date you want to check. Historical charts normally arrange records from newer to older dates or vice versa.
Always confirm the date before reading the numbers in that row.
Step 2: Check the Column Names
Look at the headings above the numbers. You may see terms such as open, close, jodi, panel, or other market-specific categories.
These headings tell you how the information should be interpreted.
Step 3: Follow the Row
Once you have found the correct date, read across the row rather than jumping between different dates.
This makes it easier to associate each number with the correct date and result category.
Step 4: Compare Older Records
If your purpose is to study historical information, you can move through previous dates and compare how the records are displayed.
Remember that comparison of past records is different from predicting future outcomes.
Madhuri Chart History and Previous Records
Historical chart information can be useful when someone wants to find an older Madhuri market record. A date-wise chart provides a convenient way to look through previous entries without visiting multiple individual result pages.
Depending on the source, historical information may cover a short period or a much longer record.
Users may refer to historical charts to:
- Locate a previous date
- Review older result entries
- Understand chart terminology
- Study the format of jodi and panel records
- Compare historical entries
- Find information that is no longer visible on a current result page
The main benefit is organization. Instead of keeping separate notes for every date, a chart brings historical entries into a structured table.
How to Check Madhuri Chart Results Online
Checking a Madhuri chart online is generally straightforward when the information is arranged clearly.
First, open a page that specifically provides Madhuri market chart or historical result information. Next, locate the date you are interested in and identify the corresponding row.
After that, check the individual columns to understand whether the displayed information represents an open result, close result, jodi, panel, or another category.
A simple process is:
Open the chart → find the date → check the row → identify the result type → review the historical information.
If a website lists several markets on the same page, make sure you are viewing the correct Madhuri section. Similar-looking tables can otherwise lead to confusion.
Why Madhuri Historical Charts Are Useful
Historical charts are particularly useful for people who want information arranged in an easy-to-follow format.
A well-maintained chart allows users to review several dates without repeatedly searching for individual pages. It can also help beginners become familiar with terms used in market-result tables.
For example, someone who does not understand the difference between a jodi and a panel can use the chart headings to see how the two categories are presented separately.
Historical charts are therefore useful as a reference and learning resource.
However, historical data should not be confused with a guaranteed prediction system. Seeing a number appear previously does not mean that it must appear again.
Common Mistakes When Reading Madhuri Charts
Beginners often make a few simple mistakes while checking historical chart information.
1. Reading the Wrong Date
One of the easiest mistakes is looking at a number from the wrong row. Always confirm the date before recording any information.
2. Confusing Jodi With Panel
Jodi and panel are different categories. Check the column heading instead of assuming that all numbers have the same meaning.
3. Assuming a Repeated Number Is a Prediction
A number appearing more than once in historical records does not guarantee that it will appear again. Historical repetition should not be treated as certainty.
4. Using an Unclear Source
If the chart does not show dates or column headings clearly, it becomes difficult to verify the information. Prefer pages where the records are presented in a structured and understandable format.
5. Mixing Different Markets
Some websites list multiple markets on the same page. Always check the market name before reading or saving a result.
Simple Example of a Madhuri Chart
A basic historical chart could be structured like this:
| Date | Open | Jodi | Panel |
|---|---|---|---|
| Example Date 1 | XX | XX | XXX |
| Example Date 2 | XX | XX | XXX |
| Example Date 3 | XX | XX | XXX |
The values above are only placeholders used to explain chart structure. They should not be interpreted as actual results.
The important point is how the information is organized. Each row represents a particular date, while the columns separate different types of numerical information.
Can Madhuri Chart History Predict Future Results?
This is an important question for anyone researching historical numbers.
A chart can show what was recorded in the past, but it cannot guarantee a future result. Historical numbers may appear to form sequences or repetitions, but these observations do not establish that a particular number will occur next.
Therefore, Madhuri chart history should be treated as historical reference information rather than a guaranteed forecasting tool.
This distinction is especially important when reading websites that present historical records alongside commentary or predictions. Readers should be able to clearly separate factual historical data from opinions or assumptions.
Tips for Checking Madhuri Chart Information
To make your chart research easier, follow a few basic practices:
- Verify the market name before checking numbers.
- Confirm the exact date.
- Read the table headings carefully.
- Keep jodi and panel records separate.
- Check whether the information is historical or current.
- Compare information when accuracy is important.
- Do not treat previous results as guaranteed future outcomes.
- Avoid making financial decisions solely from historical number patterns.
These steps can help you understand the chart without unnecessarily complicating the information.
Frequently Asked Questions
What are Madhuri chart numbers?
Madhuri chart numbers are numerical records displayed in a historical chart associated with the Madhuri market. The chart may organize information by date, result type, jodi, panel, and other categories.
How can I check Madhuri chart history?
Find a clearly organized Madhuri historical chart, locate the required date, and then read the corresponding row and result columns.
What is a jodi in a Madhuri chart?
A jodi generally refers to a two-digit pair shown as a separate category in traditional market-chart terminology.
What is a panel in the chart?
A panel or panna generally refers to a three-digit combination. It is usually displayed separately from jodi information.
Are historical Madhuri numbers guaranteed to repeat?
No. A number appearing in an earlier record does not guarantee that the same number will appear again. Historical information only describes previous records.
Final Thoughts
Understanding Madhuri chart numbers does not have to be complicated. Once you know how dates, result columns, jodi records, and panel information are arranged, reading a historical chart becomes much easier.
The best approach is to start with the date, check the relevant column heading, and then read the information across the corresponding row. This helps you avoid common mistakes such as confusing different result types or mixing records from different dates.
Madhuri historical charts can serve as a convenient reference for reviewing previous records and understanding how market information is organized. At the same time, historical data should always be viewed as past information rather than a guarantee of future results.
For beginners and regular readers alike, a clear understanding of chart structure is the most useful first step toward interpreting Madhuri market records accurately and responsibly.

Other Articles


No Comment! Be the first one.